A revenue-management experiment
Both levers, or just the price
A venue sells ten thousand seats for one night over a hundred days. Each day it sets a price and a limit on how many bookings to hold. Should one learned policy set both, or only the price? And does learning beat a textbook planner that works from a forecast? On synthetic demand, the planner wins. Among the learned policies, setting both levers pays off only when training starts from a copy of a simple rule.
01 ProblemSell every seat, and no more
Ten thousand seats expire on one night, sold over a hundred-day booking horizon. Demand is stochastic and price-sensitive, and cancellations mean the house can be sold past the seats that exist.
Each day has two controls. Price runs from $80 to $120. The selling limit runs from 10,000 to 15,000. That is the most bookings on hand the venue will accept, so every booking above 10,000 is an overbooking buffer.
Selling past ten thousand is deliberate. People cancel, and some who do not cancel fail to arrive, so a house that stops selling at capacity opens with empty seats. A seat empty on the night is revenue nobody can recover the next morning. Airlines overbook for the same reason. The selling limit is the ceiling on how far past capacity the venue will go, and it is the second thing the agent has to decide. Revenue management calls it a booking limit or an authorization level. The standard treatment is Talluri and van Ryzin (2004).
The question: should one policy set both controls, or only the price, with the limit from a formula? And how does either compare with a planner that works from a forecast?
02 SettingA simulated venue, thirty test nights
Each night is a simulation: demand arrives at the day's price, bookings fill up to the selling limit, some cancel, and some who keep their booking do not come. No box office is in this repository. Policies are compared on thirty held-out nights, June and December, seeds 0 to 29. Thirteen are soft and seventeen are peak. The number under a bar on the charts is that night's seed.
Words used on this page
- Selling limit
- The most bookings on hand the venue will accept. Anything above 10,000 is an overbooking buffer.
- Peak and soft nights
- A soft night has too little demand to fill even at $80 with no limit. The other seventeen are peak nights.
- Denied admission
- A ticket holder who arrives to a full house: an oversold seat.
- Score
- Revenue, minus $200 for each empty seat on a peak night and $400 for each denied admission. Defined below.
- A real gap
- The 95 percent paired interval on the difference between two policies, over the same thirty nights, excludes zero. Otherwise the two tie.
Each day, for 100 days. The house has 10,000 seats.
Price80 ≤ p ≤ 120
Selling limit10,000 ≤ L ≤ 15,000
DemandD = max(0, base × (1 − 1.2 × (p − 100) / 100))
Bookedmin(D, L − bookings on hand)
Still heldexp(−(t / 2000)ρ)
Show-upsbooked × still held × (1 − no-show rate)
Training reward, one night, in dollars
Rewardrevenue − 650 × unsold − 450 × oversold + bonus
Bonus80 × seats filled, only if no one is turned away
Every learned policy in the main comparison trains on this reward. Pace PPO adds a pace penalty and extra weight on soft nights. So an empty seat costs $650, and on a night with no one turned away it also misses the $80 bonus. This reward is not the score. It charges for empty seats on every night, at more than three times the score's $200. A single denied admission also costs the whole bonus. The score below is what the policies are compared on.
Score, two parts added
Scorepeak + soft
Peakrevenue − 200 × unsold − 400 × oversold
Softrevenue − max(0, revenue at $80 − revenue)
An oversold seat is a denied admission, a show-up with no seat. Every policy on this page beats a price of $80 on the soft nights, so the soft part equals soft-night revenue. A difference in the score is a ranking only when the paired interval excludes zero.
03 PoliciesThree rules, five learners, one cap
Not learned
- Myopic. Each day, the price that maximizes that day's expected revenue under the true demand model. It optimizes one day at a time and never looks ahead.
- Floor price. Always $80, limit wide open.
- Textbook planner. Plans the whole booking window from the demand forecast and the usual cancellation and no-show rates. Each day it picks a price and how many bookings to accept, and it re-plans from the bookings it has actually taken. This is the dynamic-programming approach of Gallego and van Ryzin (1994), and what a revenue-management team would build.
Learned, by trial and error in the simulator
- PPO. Learns on-policy, from fresh rollouts. Joint PPO sets both controls. Price-only PPO sets the price; an analytic controller sets the limit. Pace PPO is price-only PPO trained with a booking-curve pace penalty and extra weight on soft nights.
- Joint SAC. An actor-critic that learns off-policy, from a replay buffer, with a bonus for trying actions. It fits two continuous levers.
- Joint BC to SAC. Starts from a copy of the myopic rule instead of noise (behaviour cloning), then lets SAC improve on the copy. The copy takes both of the rule's numbers, the limit as well as the price. It fills hardest and has the most denied admission.
- Copy the myopic rulethree hundred nights of its prices and limits
- Let SAC improvethe extra fill, and the denied admission, come from here
Not a policy
- The cap. A rule applied after training, with no retraining. Once fewer than 20 percent of the seats remain, it moves a joint policy's selling limit most of the way down to the level where expected show-ups would reach 1.02 times capacity. It works out expected show-ups from the usual cancellation and no-show rates, so it is only as good as those rates.
04 Two leversBoth levers pay off only with a warm start
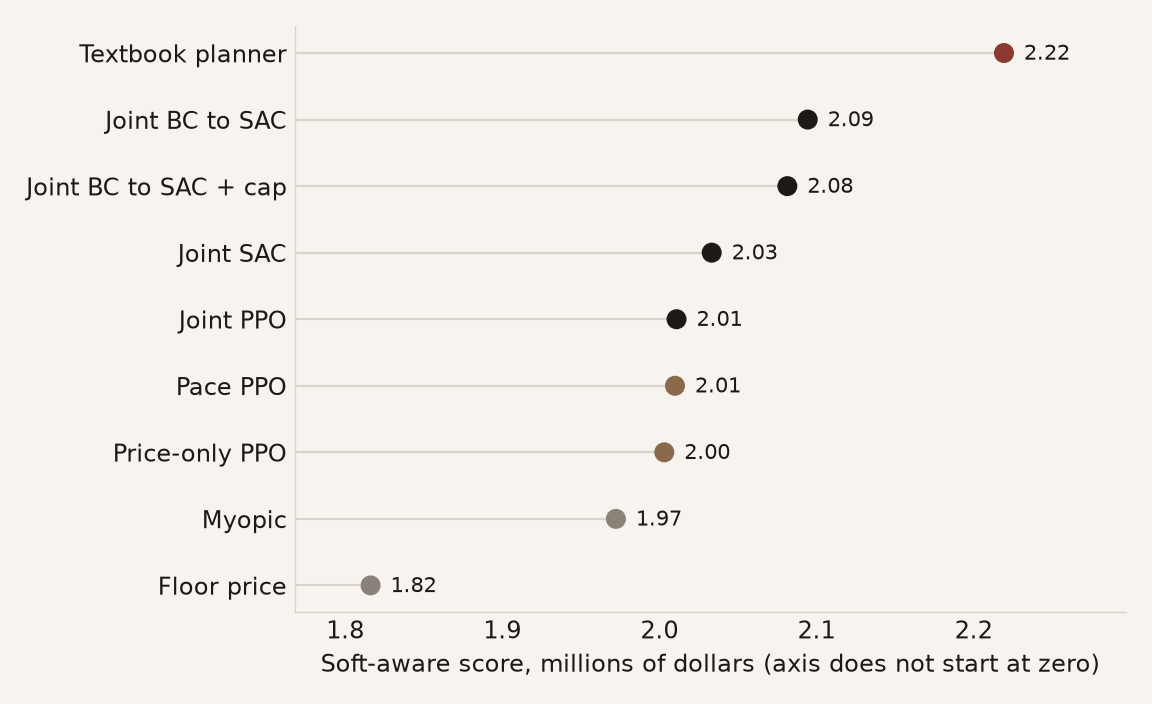
Every joint policy scores above every price-only one, but only Joint BC to SAC is ahead by more than chance. The planner, shown for scale, leads them all.
runs/explain_rl_best/.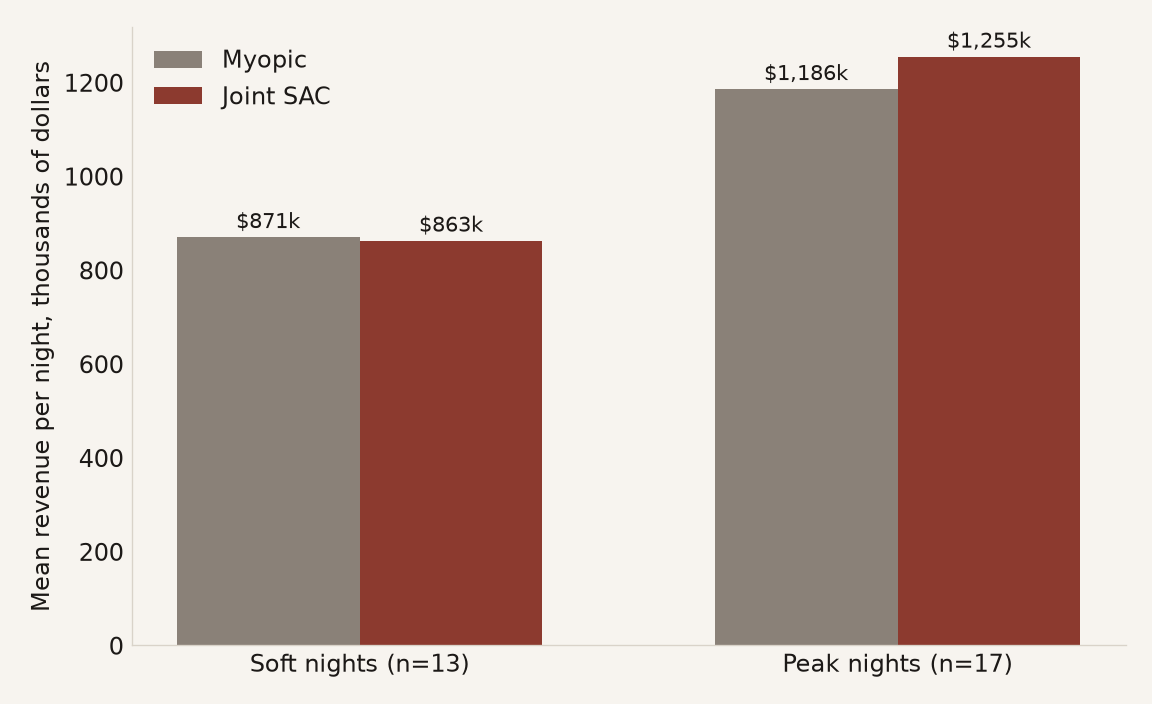
What if the selling limit is fixed?
| Policy | Learned | Wide open, 15,000 | Flat, 12,353 | Denied admission |
|---|---|---|---|---|
| Joint BC to SAC | 2.094 | 1.855 | 1.943 | 0.71 → 0.82 |
| Joint SAC | 2.033 | 1.689 | 1.914 | 0.18 → 0.82 |
| Joint PPO | 2.011 | 1.903 | 1.921 | 0.35 → 0.82 |
Scores are in millions. Learned, wide open, and flat are three scores for the same prices. Only the selling limit changes. The last column is the share of peak nights with denied admission, first with the learned limit, then with the limit pinned at 15,000. Joint SAC's limit averages 12,578, within 2% of the flat pin at 12,353. Forcing it to stay at 12,353 still costs $120,000, because the learned limit changes from day to day and the flat pin does not.
When no one may be turned away
| Policy | Score | Against pace PPO |
|---|---|---|
| Joint BC to SAC + cap | 2.081 | Ahead, and the paired interval excludes zero |
| Pace PPO | 2.010 | — |
| Joint SAC + cap | 2.009 | About level; no paired interval |
| Price-only PPO | 2.003 | About level |
| Joint PPO + cap | 1.962 | Behind |
Scores are in millions. Every policy here turns no one away on these thirty nights. The price-only policies never overbook. The joint policies get there through the cap, which lowers the selling limit after training and costs them 0.6 to 2.4 percent of score. With that rule in place, only Joint BC to SAC still beats a price-only policy.
05 PlannerA planner with a forecast beats the best learned policy by 3 to 5 percent
Planning the whole booking window beats every learned policy under the right forecast, under the wrong demand forecasts tried, and under most wrong show-up rates. Its one weak spot: expecting more cancellations than really happen. Neither side carries the cap in this section.
Myopic plans one day at a time. A revenue-management team would plan the whole booking window from a forecast and re-plan as bookings come in: the textbook planner from section 03.
The planner against the best learned policy
| What the planner knows | Planner | Best learned | Planner ahead |
|---|---|---|---|
| The right forecast | 2.219 | 2.155 | +0.064 (2.9%) |
| A wrong demand forecast (worst of three tried) | 2.164 | 2.087 | +0.078 (3.6%) |
| Each night’s demand and show-ups differ from the forecast (up to ±25%) | 2.121 | 2.022 | +0.099 (4.7%) |
Scores are in millions. No cap on either side, and every learned policy sees only the venue's own show-up estimate. Best learned: in the first row, Joint SAC retrained on all twelve months; in the second, Joint SAC on the $200 and $400 reward of section 06, which reads no forecast, so a wrong one does not move it; in the last, Joint SAC retrained on such nights, while the planner keeps the usual forecast and rates and never learns what each night drew. The gap is real in the first and last rows.
When the cancellation and no-show rates are wrong
The planner leans on its cancellation and no-show rates, and it cannot tell they are wrong until the night itself. Give every policy the same wrong rates:
When the show-up rates are wrong
| The rates the policies are given | Planner | Best learned | Ahead |
|---|---|---|---|
| Fewer no-shows than real | 2.127 | 2.088 | Planner |
| Fewer cancellations than real | 2.108 | 2.094 | Planner, narrowly |
| More no-shows than real | 2.091 | 2.078 | Planner, narrowly |
| More cancellations than real | 1.958 | 2.074 | Learned, by 116,000 |
Scores are in millions. Rates moved by the kind of error a venue estimating from its own history could make. Best learned is the higher of the two uncapped joint SAC policies in each row. No paired intervals.
- The planner's weak spot. When it expects more cancellations or no-shows than really happen, it overbooks every busy night: it loses 5.8 percent with too many no-shows assumed and 11.8 percent with too many cancellations. The learned policies lose about 3 percent at worst, and win the cancellation case.
- The wrong demand forecasts tried matter less. A wrong price sensitivity costs myopic up to 5.8 percent and the planner up to 1.35. The learned policies read no forecast and do not move.
Why the learned policies trail
Five retrains that see only what a venue sees, trained on the score’s own costs, one training seed each.
What explains the gap
- Months never seen in training: about 40 percent of it. The learned policies trained on ten months and were tested on June and December. Retrained on all twelve, the gap falls from 4.8 to 2.9 percent. For a real venue that means history covering every season, not more nights of the same ones.
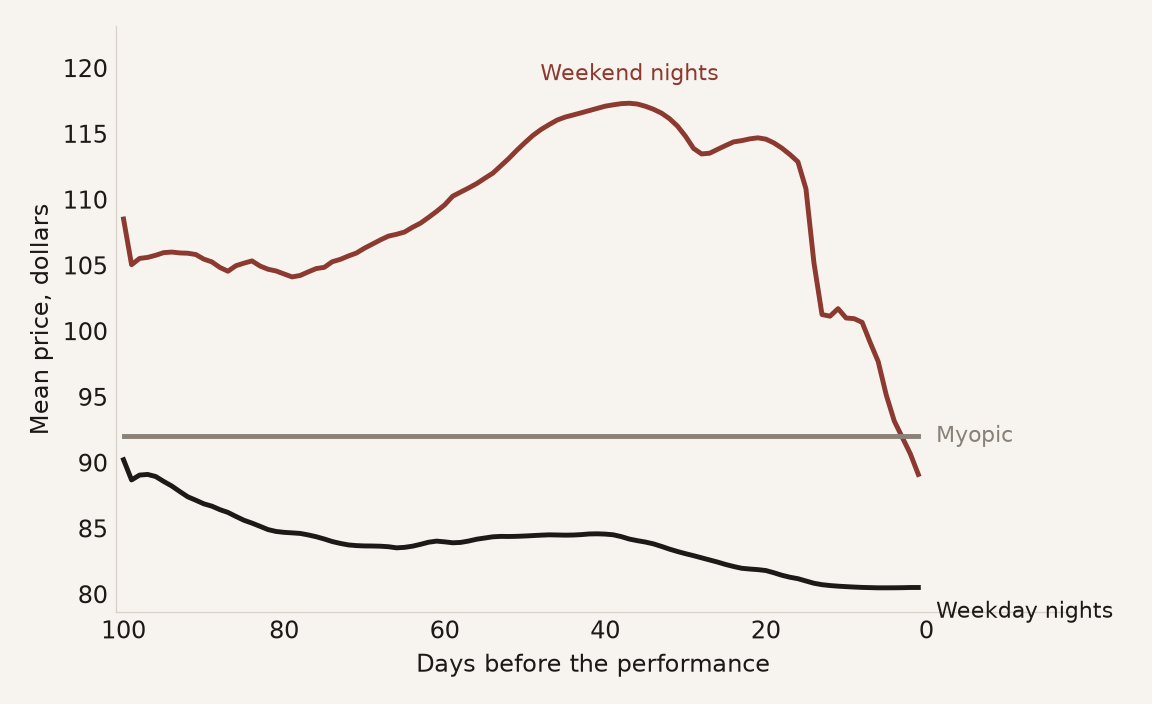
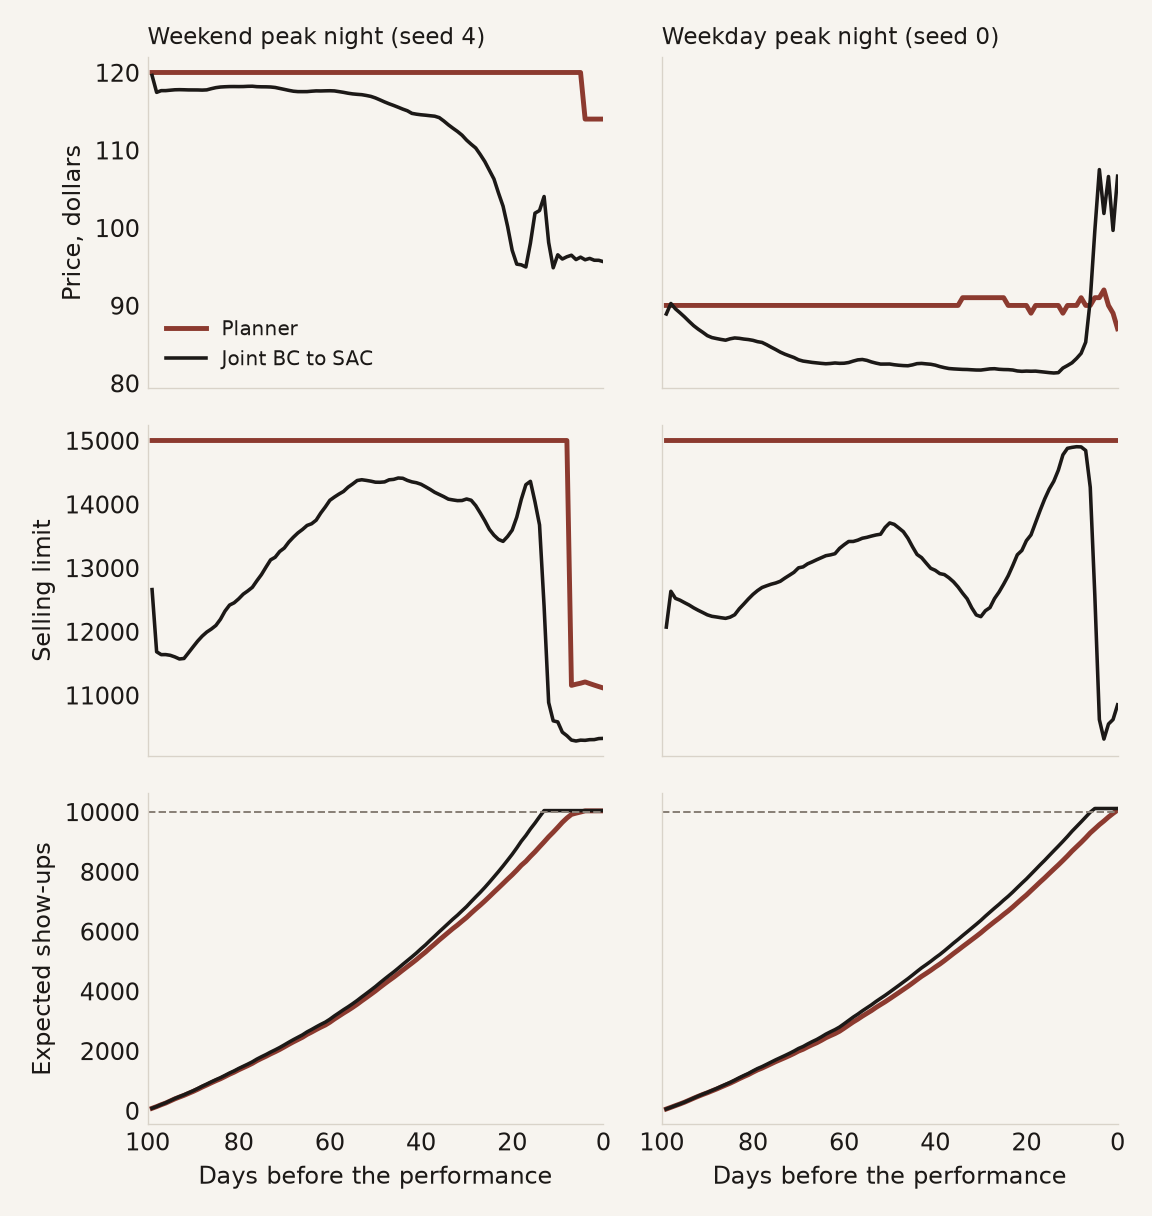
- Approximation: the rest. The planner computes each day's decision exactly from its model; the learned policy recalls an approximation from about two thousand practice nights. It sells too cheap and fills one to two weeks early, as in the chart above.
- Why it cannot overtake. The planner optimizes the score on the simulator's own model. Even seeing each night's actual no-shows would add only 1.1 percent, so there is little room above it.
What did not close it
- A reward that matches the score: +$25,000, a tie.
- Training across years that miss the forecast: still 1.6 to 3.8 percent behind in years 20 percent below or above it, because the planner re-plans from its own bookings.
- Correcting the planner instead of replacing it: 0.7 to 1.5 percent worse, even when demand arrived 10 days early or late.
Details: sections 14 to 19 of the experiment log.
06 VariationsBlock markdowns; choose the reward's costs
Two changes to the setup, each tried on Joint SAC: a rule that the price never falls, and a different price list in the training reward.
The late markdown was losing money
In the price-path chart, the weekend price falls from $117 to $89 in the last weeks, so a late buyer pays less than an early one. A venue cannot do that to its early buyers. Four ways to stop it, against no rule:
The price may rise, but never fall
| How | Score | Markdowns |
|---|---|---|
| No rule | 2.033 | 1,672 |
| Block price drops at decision time, no retraining | 2.078 | 0 |
| Copy the blocked policy, no further training | 2.039 | 0 |
| A fine for each drop (best of seven strengths) | 2.049 | 1,377 |
| Train a new policy under the rule | 1.923 | 0 |
Scores are in millions, on the thirty nights. Markdowns are days the charged price fell. The block overrides the policy on 2,610 of its 3,000 decisions and still scores higher, with the paired interval above zero.
Block, don't retrain. The late markdown was losing money. Training under the rule makes the policy open cheap and stop moving the price, and a fine does not stop the drops. Details: runs/price_monotone_up/.
The reward decides the overbooking
The training reward in section 02 is a price list: what each mistake costs the policy. We changed two prices and trained Joint SAC again, same settings, same seed.
Same policy, two price lists
| Original reward | New reward | |
|---|---|---|
| An empty seat costs | $650, and it misses the $80 bonus | $200 |
| A denied admission costs | $450, and the first one loses the whole bonus | $400 |
| Peak nights that turn people away | 3 of 17 | 11 of 17 |
| Score | 2.033 | 2.088 |
| Score with the cap | 2.009 | 2.096 |
Scores are in millions. The paired interval on the gain sits above zero.
- Why it changes. Under the original reward the first person turned away costs the whole bonus, so the policy keeps a safety margin. At a flat $400, it overbooks whenever it expects enough no-shows. The gain is all on busy nights.
- The costs are a business choice. What an empty seat and a turned-away ticket holder cost is a judgement about the venue: lost concessions, refunds, compensation, reputation. Put those costs in the reward, and the policy follows them. Change them, and you get a different policy.
- The catch. The cap no longer gets denied admission to zero, and the score charges the same $400 per denied admission as the new reward. If turning a ticket holder away really costs the venue more than about $650, the old reward wins. One training run. Details:
runs/objective/.
07 Which to usePick by what you know
| When | Use |
|---|---|
| You can build a demand forecast and estimate cancellation and no-show rates | The textbook planner. It leads every learned policy under the right forecast, the wrong demand forecasts tried, and most wrong show-up rates. If you may be overestimating cancellations, add the cap: it lowers the selling limit near the end and removes that weak spot. |
| Before training any policy | Set the costs in its reward to what an empty seat and a turned-away ticket holder really cost your venue. The policy will follow them. |
| A learned policy that turns almost no one away | Joint BC to SAC with the cap. Denied admission falls to zero on the published weights, but not on every retrain, and only while the cap's rates are right. |
| The policy should set only the price | Pace PPO. An analytic controller sets the selling limit, and denied admission on these thirty nights is zero. |
| Later buyers must never pay less than earlier ones | Keep the policy and block price drops at decision time. It scores higher than the same policy unblocked, with no retraining. |
| No demand forecast can be built at all | A learned joint policy. It reads bookings and the calendar, not a demand model. |
| You cannot estimate cancellations and no-shows at all | Nothing here is safe. Every policy overbooks when those rates are overestimated, and the cap does too. |
08 LimitsWhat this does not show
- The sample. The demand model is synthetic. There is one product and one venue. Every chart uses the same thirty held-out nights, seeds 0 to 29, in June and December. Train the same policy again on another machine and the weights will not match bit for bit.
- Ties. A gap ranks two policies only when its paired interval excludes zero. Capped Joint BC to SAC over pace does, at 3.6 percent. Joint SAC and Joint PPO against pace do not.
- Training seeds. The published Joint BC to SAC and pace PPO weights are training seed 42; Joint SAC is seed 7 and Joint PPO seed 49. Retrains of Joint BC to SAC at seeds 43 and 44 also beat a pace run from the same seed. The retrain at seed 46 ties its matched pace run. Most results on this page are one training run.
- The show-up count. The published learned policies and the cap read a count of expected show-ups built from the true cancellation and no-show rates, which no venue has. With the venue's own estimate and the right rates, scores move by under 0.1 percent. With wrong rates, every policy overbooks more, and the cap no longer holds denied admission at zero. The retrains in section 05 see only the venue's estimate.
- Test months never seen in training. The learned policies train on ten months and are scored only on June and December, which they never saw; the planner's forecast covers every month. That split tests generalization. Retrained on all twelve months, the gap to the planner falls from 4.8 to 2.9 percent (section 05, one training seed). A venue would train on every month it has history for.
- The planner's advantage. The planner is handed the simulator's own demand model, and day-to-day demand here is fairly predictable. Its forecast was made wrong in these ways: price sensitivity off by a quarter either way, weekend and peak demand 25 percent too low, and random errors of up to 25 percent on each night, a whole year 20 percent above or below forecast, and demand arriving 10 days early or late. A planner that re-plans from its own bookings absorbed all of these. Not tested: customers who wait for a lower price, demand that depends on past prices, and problems too large to plan exactly, such as several seat tiers sharing one house. Those are where a learned policy could still come out ahead.
- Myopic. Its selling limit, 12,353, never binds: it holds at most 11,402 bookings. That is why pace PPO, not myopic, is the price-only comparison.
09 BackgroundWhere this sits
Quantity control protects seats at posted fares. Dynamic pricing sets the price path from capacity left, as in Gallego and van Ryzin (1994). Talluri and van Ryzin (2004) cover both lines. Recent work asks the question this experiment asks. Lange, Dreessen, and Schlosser (2025) find a planner fitted to data does best when data is scarce, and reinforcement learning overtakes it with about a hundred seasons of data or more. Razumovskiy and Karenin (2026) find the fitted planner best and steadiest on simple single-product problems, with reinforcement learning catching up only on larger ones. This experiment is the simple case: one night, and a planner given the simulator's own demand model. Kastius, Hagedorn, and Schlosser (2026) survey reinforcement learning for dynamic pricing.
Four differences from that line:
- Both controls, one policy. Those two literatures usually keep the levers apart. One sets booking limits at posted fares. The other sets a price path given the seats left. Here one agent sets price and the selling limit together. A price-only twin, run on the same nights, measures what dropping the limit costs.
- No demand forecast in view. Classic booking limits and Gallego and van Ryzin's price path both need one. The learned agents see only where bookings stand and what day it is. They still learn two price paths. On weekends the price rises toward the date, then falls. On weekdays it eases down to $80. The planner in section 05 is the forecast-based comparison.
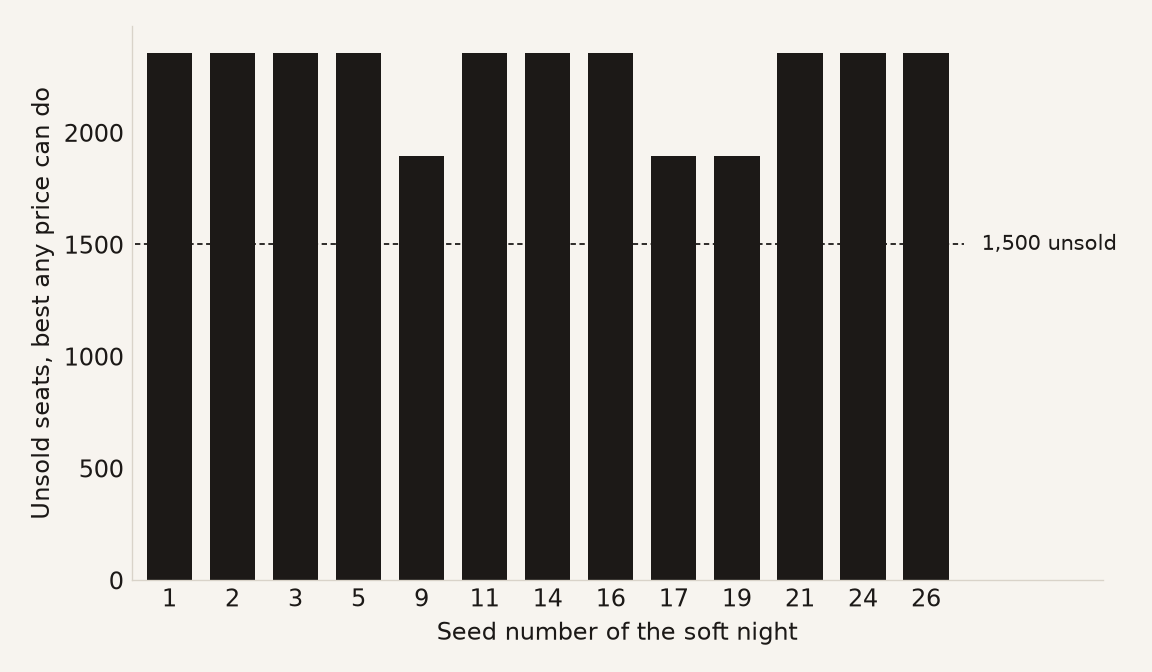
- Empty seats are not the main measure. Counting empty seats would call every soft night a failure. But on this demand, even the $80 floor with no selling limit leaves each soft night more than 1,500 seats empty, so no policy can fill them. The score charges for empty seats only on the peak nights.
- Overbooking is priced in training and capped only after it. Classical overbooking is designed into the optimization. Here the training reward charges for denied admission but does not forbid it, so a trained policy may overbook. A cap applied afterwards, with no retraining, takes denied admission to zero on the published weights, as long as the cancellation and no-show rates it uses are right.
References and further reading
- Gallego, G. and van Ryzin, G. (1994). Optimal dynamic pricing of inventories with stochastic demand over finite horizons. Management Science.
- Talluri, K. and van Ryzin, G. (2004). The Theory and Practice of Revenue Management. Springer.
- Lange, F., Dreessen, L., and Schlosser, R. (2025). Reinforcement learning versus data-driven dynamic programming: a comparison for finite horizon dynamic pricing markets. Journal of Revenue and Pricing Management, 24(6), 584–600.
- Razumovskiy, L. and Karenin, N. (2026). A comparative study of dynamic programming and reinforcement learning in finite horizon dynamic pricing. arXiv:2604.14059.
- Kastius, A., Hagedorn, C., and Schlosser, R. (2026). Reinforcement learning in dynamic pricing: a survey. Journal of Revenue and Pricing Management.